Connection pooling and limits
How Supabase pools database connections, and the limits that apply to them.
Learn how to choose between connection modes, size a pool, and work out why you're running out of connections. To get connected, see Connect to your database.
How connection pooling works #
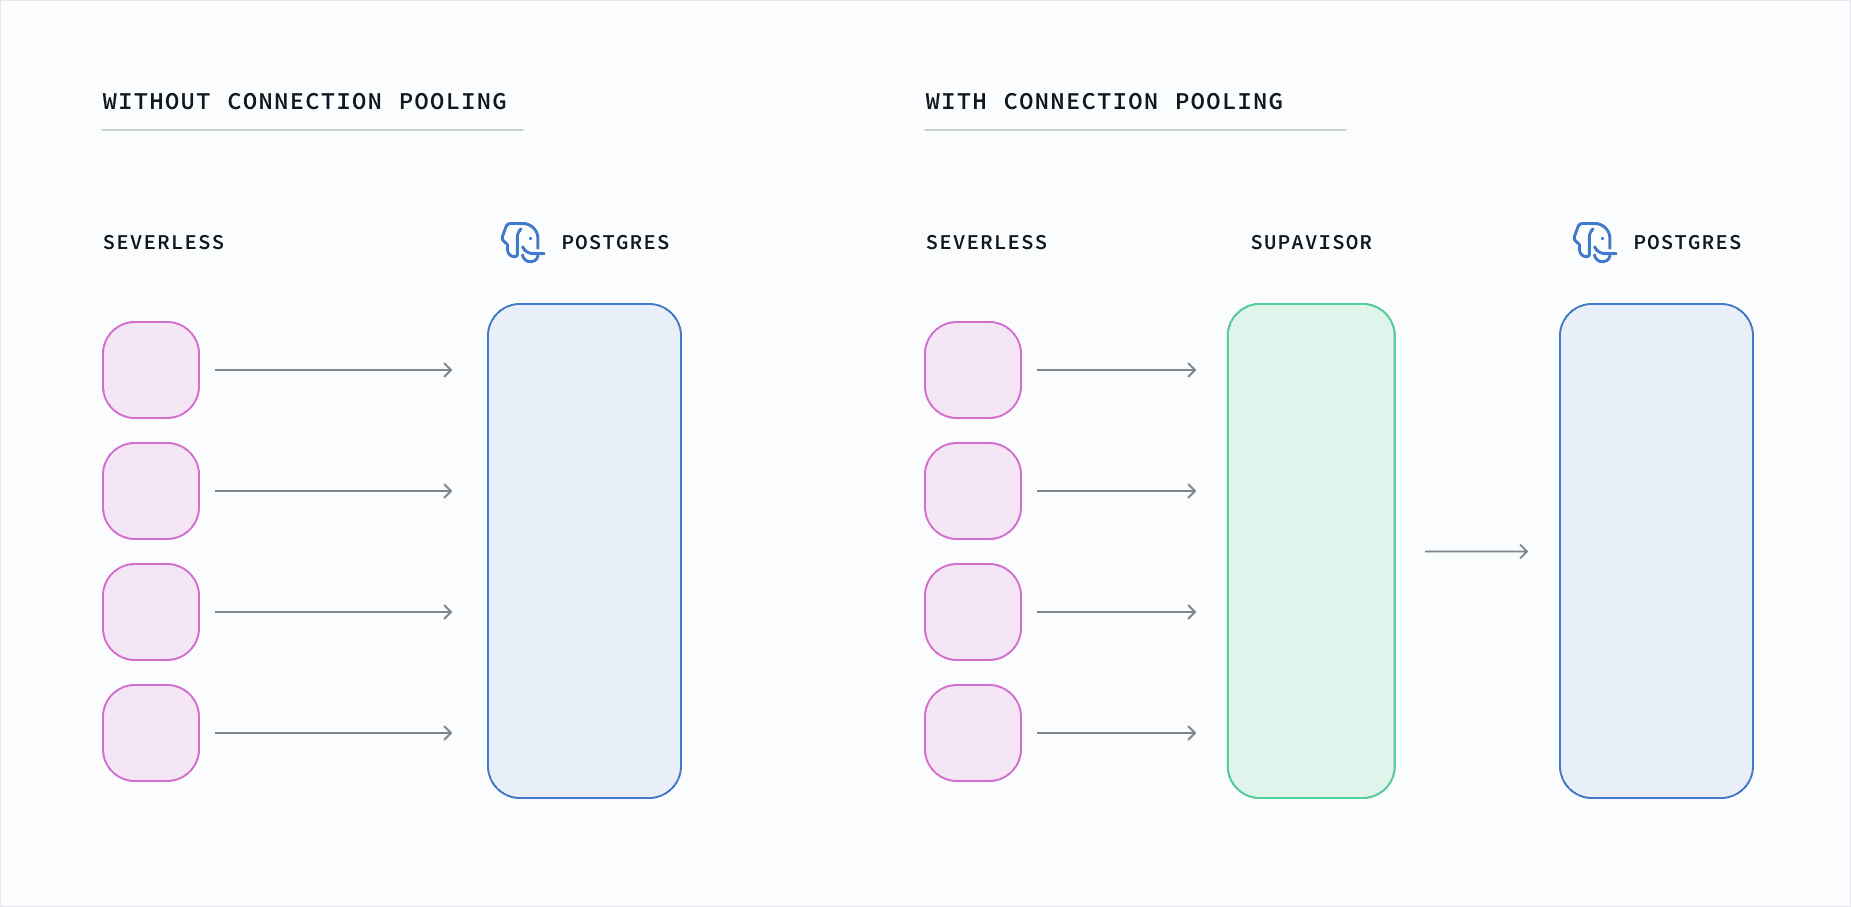
Connection pooling improves database performance by reusing existing connections between queries. This reduces the overhead of establishing connections and improves scalability.
A Postgres connection is a long-lived session. Once established, it stays open until the client disconnects, or until the server or the network closes it. A server might make a single 10 ms query but hold its database connection for seconds or longer.
A pooler sits between clients and the database and shares a small set of database connections across many clients, so a connection isn't tied up while a client sits idle.
Application-side and server-side poolers #
There are two kinds, and they work together.
Application-side poolers are built into connection libraries and API servers, such as Prisma, SQLAlchemy, and Postgres.js. They keep a few connections open and reuse them. On a persistent backend, such as a long-running container or VM, an application-side pooler is enough on its own.
Server-side poolers, such as Supavisor in transaction mode, run in front of the database and serve many clients. Use one when connections come from serverless or edge functions, or from anything that scales horizontally. These environments open many short-lived connections, which is the case an application-side pooler can't cover.
For more on when each is needed and how to size them, see the Supavisor FAQ.
Shared and dedicated poolers #
Supabase offers two poolers. The shared pooler, Supavisor, is multi-tenant, available on every project, and IPv4-only. The dedicated pooler, PgBouncer, is available on paid plans and runs alongside your Postgres instance. Like the direct connection, it is on IPv6, or on IPv4 if the project has the IPv4 add-on.
The dedicated pooler runs on the same machine as your database, so it connects with lower latency than the shared pooler, which runs on a separate server. It also uses more of your project's compute resources. If your network supports IPv6, or you have the IPv4 add-on, use the dedicated pooler instead of the shared pooler. Direct connections have no pooler overhead, but they require IPv6 unless you have the IPv4 add-on.
In most cases, choose either PgBouncer or Supavisor for pooled or transaction-based traffic. Direct connections remain the best choice for long-lived sessions, and shared pooler session mode is the alternative when those sessions need IPv4. Run both poolers at once only when you need to raise the total number of concurrent client connections, and expect a higher risk of hitting your database's maximum connection limit on smaller compute sizes.
Connection limits#
Pool size #
Pool size sets how many connections a pooler is allowed to open to Postgres. You can adjust it in Database settings in the Supabase Dashboard.
Supavisor and PgBouncer read the same setting but apply it independently, so raising it raises the ceiling for both.
For what the setting counts, and how it interacts with the user, database, and mode combinations connecting to your project, see the Supavisor FAQ.
Client connections and backend connections #
There are two limits to understand when working with poolers.
| Limit | What it counts | What sets it |
|---|---|---|
| Client connections | How many clients can connect to a pooler at the same time | Your compute size's max pooler clients limit |
| Backend connections | How many active connections a pooler opens to Postgres | The pool size for that pooler |
Both limits apply independently to Supavisor and PgBouncer. One pooler reaching its client limit doesn't affect the other. When a pooler reaches this limit, it stops accepting new client connections until existing ones close.
Direct connections + Supavisor backend connections + PgBouncer backend connections< Postgres max connections for your compute instanceStay below the maximum rather than at it. Supabase services hold their own connections, including Auth, Storage, PostgREST, and the health checker, and those come out of the same total. Managing connections covers how much headroom to leave.
For the connection counts that come with each compute size, see compute and disk. For the terminology, see Supavisor and connection terminology explained.
Monitor connection usage #
Track connection usage in the Observability section of the Supabase Dashboard. There are three reports:
- Database Connections: total active connections by role, including direct and pooled connections.
- Dedicated Pooler Client Connections: active client connections to PgBouncer.
- Shared Pooler (Supavisor) Client Connections: active client connections to Supavisor.
These reports are not real-time. They show the connection count from the last refresh. For up-to-the-second data, query pg_stat_activity in the SQL Editor:
-- Count connections by application and user nameselect count(usename), count(application_name), application_name, usenamefrom pg_stat_ssl join pg_stat_activity on pg_stat_ssl.pid = pg_stat_activity.pidgroup by usename, application_name;To list every connection with its state and query, and to read which Supabase service each role belongs to, see Managing connections.